The Platform
Formation intelligence — from signal to action.
Every cell encodes its future quality in the voltage-capacity curve produced during formation. Moldpathio extracts that signal in real time and puts an actionable alert in your team's hands — before the formation cycle finishes.
Plug into your existing cycler stack
Moldpathio is not a formation cycler. It is not a MES. It does not replace your existing process control infrastructure. It reads the data your cycler already generates and extracts quality signals that your current stack doesn't compute. Our edge connector runs on a small form-factor PC at the cycler rack — no cloud upload required during formation, no changes to your cycler firmware or formation protocol.
- CANBUS, Ethernet, file export protocols
- 1-second resolution voltage, current, temperature, capacity
- Local edge processing — no data leaves your facility during formation
- Setup time: 4–6 hours per formation line
Formation signature ML engine
We decompose each cell's voltage-capacity differential curve (dQ/dV) into characteristic peaks. Our model has learned that specific peak displacement patterns at C/10 rate precede 94% of cells that fail capacity, impedance, or cycle-life acceptance criteria.
- 40+ feature vectors per cell per 5-minute scoring window
- Lithium plating, separator integrity, electrolyte distribution detection
- 2-week per-site calibration window adapts to your chemistry
- 200 M+ cycle training base — pre-calibrated for NMC, LFP, NCA chemistries

Not just a flag — a root cause taxonomy
Each alert includes defect classification (lithium plating risk, high internal resistance, low capacity outlier, electrolyte uniformity flag), confidence score, affected cell positions in tray, and recommended process adjustment vector.
Line managers can act on the alert immediately — no manual investigation required before making a process call.
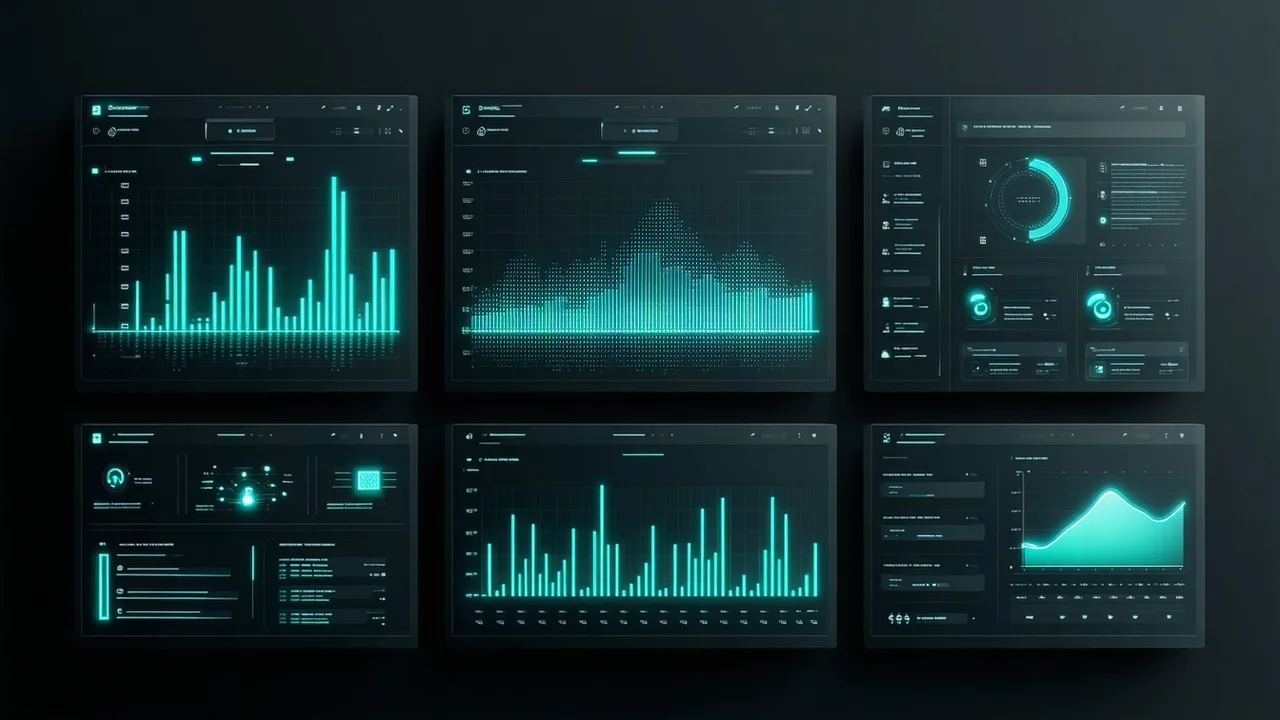
Shift-level yield dashboard
Real-time formation yield by tray, shift, and formation channel. The dashboard surfaces systematic drift patterns before they compound into significant scrap events.
- Per-channel yield % over configurable time windows
- Alert timeline with root cause distribution
- CSV and JSON export for MES integration
- REST API for custom downstream analytics
See the platform on your formation data.
We'll walk you through a live formation run analysis using sample data from your chemistry profile.
Request a Platform Demo